


Facebook have started rolling out the new Facebook Insight dashboard to Page owners and I have to say – it’s pretty awesome! While taking notes to review it, I noticed that Facebook have introduced a new metric – their own version of Engagement Rate, to replace Virality for Page posts.
This is Facebook’s definition of its Engagement Rate:
Engagement rate is the percentage of people who liked, shared, clicked or commented on a post after having seen it.
This is an important move for Facebook as it distances itself from Virality (which was briefly available along with the Engagement Rate, until it got pulled on Friday).
On the subject of engagement, there are two ways that marketers get their engagement rate: out of fanbase and out of reach. The difference is not specified in Social Monitoring tools, while only a handful are transparent enough to show you how this metric is being calculated.
But what if I told you that the Engagement Rate you’ve been reporting on is actually not what you’re looking for?
Engagement out of Fanbase
Advocates: SocialBakers, Mari Smith (facebook.com/marismith/posts/10150962842520009)
Engagement out of fanbase is a metric that calculates the ratio of engagement out of the number of fans. It’s the most known approach, the default formula for quite a few analytics tools out there, and the method that most marketers swear by.
It follows the following formula:
[sum of engagement] / [total number of fans]
Some tools and agencies define the sum of engagement as the total number of main engaging actions that users can perform (i.e. likes, comments, and shares). However, the most common approach is to take the PTA(T) [People Talking About (This)] as the ‘sum of engagement’. By using this approach, you’re counting in the following actions:
- liking a post
- liking a comment
- commenting on a post
- commenting on a comment
- sharing a post
- answering a question/”poll”
- responding to an event
- claiming an offer
- posting on the page wall
- mentioning the page in a post
- tagging the page in a photo
- checking in at your place/page
- sharing a check-in deal
- liking a check-in deal
- writing a recommendation
- liking a page
Engagement out of fanbase has been used as an indication of how much of your fanbase you’re able to engage with your content. The most notable advocate for this is SocialBakers, who came out in March 2012 with a viral blog post on how to calculate engagement rate on Facebook and Twitter.
Engagement out of Reach
Advocates: Facebook, SimplyMeasured
Engagement out of reach is a metric that calculates the ratio of engagement out of the number of people reached. It’s a less known approach as most tools don’t actually offer this, and it’s not even an approach that is being talked about most bloggers and marketers either. However, it’s interesting to see that Facebook favours this approach in its own Insight dashboard.
The way this metric is calculated is by using this formula:
[sum of engaged users] / [people reached]
So, which one’s better?
First of all, the real question is: what do you think the Engagement Rate is? Let’s settle on a definition of Engagement Rate. I propose the following:
Engagement Rate is the measure of how well your audience responds to your Page content.
Agree? Ok. Now, if that is what you’re looking for in your Engagement Rate metric, calculating the Engagement Rate out of Fanbase is not what you’re looking for, and it’s a mathematically incorrect metric. Here are the 5 main reasons why:
1. Using the PTA(T) as your numerator is an unfair representation of ‘engagement’
Let’s look back at what PTA(T) is: it’s the sum of all possible interactions between a Facebook user and your Page (along with its content) as long as those interactions create a ‘story’ (more on this later). Hence, if 100 people click ‘like’ on your Facebook Page, 100 will be added to your PTAT. However, what if only 5 of the 100 people who liked your Facebook Page today actually interacted with your content? Then PTAT will add those 5 interactions to the previous 100 likes, leaving you with an inflated number that does not correctly represent interactions with your content.
2. Not all interactions are included in PTA(T)
Clicking on your post, opening a picture on your page, pressing play on a video, and clicking on a link are just some of the ways Facebook users can interact with your Page content. However, those won’t be counted towards PTA(T). Why? Because they don’t create what Facebook calls “stories”. A story is an item that is displayed in your News Feed or News Ticker (until the old layout completely fades out). So, an example of a story is “Ben liked a picture“, “Ben commented on a post“, “Ben was tagged in a picture“. However, clicking on a page post, opening a picture, pressing play on a video or clicking on a link does not create a story. Because of that, those interactions aren’t counted in PTA(T). However, those actions are still a part of engagement – a Facebook user might not click ‘like’ on a video you’ve posted on your Page, yet if he clicks on play and watches it, he still engaged with your content. Using PTA(T) as your numerator means that all of these interactions that do not explicitly create a story will get lost – even though they’re an equally important chunk of possible interactions and engagement between your fans (and non-fans) and your Page.
3. You’re assuming that only your fans are engaging with your content
Using the number of fans as your denominator is a wrong assumption for one big reason: your audience doesn’t consist of just your fans. In fact, you might even see that a big chunk of people who engage with your content are not even your fans (to which you can then ask – why is my content encouraging people to engage with my Page and not be a fan of it?). This wrong assumption will also result in a wrong calculation. By doing so, the interactions by users who aren’t your fans will be wrongly attributed to those who are your fans. Simply put, you’re using a ratio of interactions made by fans AND non-fans out of the number of fans. The only way this formula could be accurate is if you only counted the number of interactions made by your fans.
4. Your audience doesn’t only consist of your fans
There seems to be an ever-increasing obsession on the number of fans – getting more fans, increasing the fanbase… This is also reflected in the fact that the denominator for the Engagement Rate out of Fanbase is the number of fans on a given day. However, the reality is – when it comes to the engagement on your Page, what really matters is the audience you had at the time of posting and how many out of that interacted with such content – regardless of whether they’re your fans or not. The metric that can give you the size of the audience isn’t the total number of fans – it’s the Reach.
5. If you use PTA(T) as part of the numerator, you’re not counting people but interactions
Since PTA(T) stands for ‘people talking about this’, it’s easy to think that if you divide it by the number of fans you get the rate of engaged users for that content. However, despite the name, PTA(T) doesn’t count people who engage with your content, but their interactions. One fan can be responsible for 20 likes, 5 comments and 3 shares, and it would be counted as “28 people talking about this”.
Still not convinced?
Here’s a very practical and straightforward example to describe this:
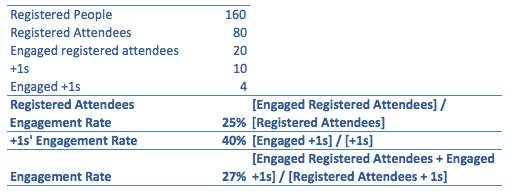
160 people RSVP ‘yes’ to an event. However, on the day of the event, only 80 people attend, while the other 80 are still marked as RVSP’d ‘yes’. Throughout the event, 20 people engage with the speaker, be it by asking questions or joining in the conversation, while the other 60 just listen intently.
Here’s the question: if you were the speaker, how would you calculate the ratio of engaged people, i.e. the engagement rate of the event?
Now let’s just say, for argument sake, that there are 10 +1s in the audience. These are friends of some of the people in the audience who had RSVP’d ‘yes’ to the invitation, even though these +1s aren’t actually registered. Out of the 10 +1s, only 4 engaged with the speaker.
Now, how would you calculate the engagement ratio? Would it look something like the following?
Now, ask yourself – why didn’t you calculate the rates like this…

Perhaps you chose the first method because, after all, if you want to calculate the rate of engagement of the registered attendees you need to count in those who attended, not everyone who RSVP’d ‘yes’ – it wouldn’t be fair to count in the people who were not part of the audience: the very fact that they were not part of the audience means that they wouldn’t have been able to engage with the event in the first place.
Perhaps you chose the first method because, after all, if you want to calculate the rate of engagement of the +1s, you should only factor in the number of engaged +1s and their total number. After all, why would you divide the number of engaged +1s by the number of registered users, when the +1s aren’t even registered?
Perhaps you chose the first method because, after all, if you want to calculate the overall engagement rate, you need to count in the engaged registered users as well as the engaged +1s (regardless of the fact that they weren’t registered), and divide that by the total number of people in the audience – the registered users and +1s.
If you agree with the three statements above, then you understand the principles behind calculating the Engagement Rate out of Reach rather than out of Fanbase.
So what’s the ‘magic formula’?
First of all, let’s recap what we need from an engagement formula, before we come up with one.
- The Engagement Rate should include all interactions, whether they create a Facebook story or not. This includes viewing photos, clicking on links, playing a video etc.
- The Engagement Rate should not exclude users who aren’t fans of your page, especially since they too can interact with your content without being your fan.
- The Engagement Rate should be taken out of the audience of your content, hence your Reach. Only this number can give you a realistic indication of who saw your content, thus having the chance to engage with it.
Based on those 3 principles, here’s how you would calculate the Engagement Rate out of Reach:
[Engaged Users] / [Reach] %
Even though we’ve been discussing engagement rate for your content, you can still use the same principle to derive a formula for the engagement rate for your pages. This is especially useful if you need to benchmark your Page against other pages you own. Just use this formula:
([Engaged Users] / [# of posts]) / [Reach]
Now What?
If you do have a tool that calculates engagement out of fanbase, or you’re not sure how the engagement is being calculated in your tool, I recommend you start a discussion with the company that provided you the tool. You could even send them this article to initiate a discussion on how engagement is calculated and changes that should happen in the tool thereafter.
The good news is, whether your tool calculates engagement out of reach or fanbase, or even if you currently do not have a tool, you can STILL calculate this on your own by using the Engagement Rate formulas.
Then, if you want, you can even break that engagement rate down in 3:
– Engagement Rate out of Organic Reach: [sum of engaged users reached organically] / [organic reach]
– Engagement Rate out of Viral Reach: [sum of engaged users reached virally] / [viral reach] (to see the propensity of your fans’ friends to engage with your content)
– Engagement Rate out of Paid Reach: [sum of engaged users reached through paid content] / [paid reach] (to justify paid campaigns on Facebook – if you’ve ever needed a metric to justify getting more budget in your social campaigns, this is the metric you’ll need)
One last note…
No two tools are the same. In fact, you can have two tools measuring a metric that is called the same across the two, but is calculated differently.
For example: according to SimplyMeasured, engagement is likes, comments and shares; however, according to Facebook, it’s likes, comments and shares, as well as clicks on the post (e.g. opening a picture, clicking on ‘play’ on a video, clicking through a link).
Here’s the lesson: question everything about your analytics tool – whether it’s a free tool or a premium one, whether you’ve had it for a long time, just acquired, or you’re thinking of adopting one. Make sure you understand exactly how each metric that you’re going to report on is calculated, and try and match it with your own calculations to see how accurate your reports are going to be if you decide to rely on whatever tool you have.
Let me know in the comments section what your thoughts and don’t forget to share this article!
This is good stuff.
Thanks Charlotte, I’m glad you enjoyed it 🙂
You are a genius!
Thanks Charlotte, you’re a star! 🙂
Hello. This is a very good article about engagement rate. How should we count the engaged users and reach from the data we export from Facebook?
Which columns should we choose, Engaged Users:
DailyPage Engaged Users or Weekly Page Engaged Users or 28 Days Page Engaged Users
and for reach
Daily Total Reach, Weekly Total Reach, 28 Days Total Reach
What do you count? Sum or Average?
Hi, that’s a great question. Unless you’re looking for a moving weekly or four-weekly number, go for daily. Having said that, do NOT add them together. Adding the daily total reach from Monday to Sunday will give you a different (and higher) number than the weekly total reach. This is because the weekly total reach calculates the number of unique users reached. Adding the daily reach for multiple days means you’ll end up double-counting the number of people who were reached by your post.
I hope that answers your question!
Hello Ben! Thank you for your reply. For start i choose to check engagement rate monthly. So should i take the 28 days metric? If yes, should i take the average?
But this of course starts another conversation. How often should an administrator check the engagement rate? Daily? Weekly or monthly? I would love to hear everybody’s opinion!
No worries! How often should you check? It’s best practice to keep an eye on it daily and report on it on a weekly basis. Checking daily you’ll see the performance of your recent posts, see what worked and what didn’t and get some insights from it; reporting weekly you’ll start seeing trends and common behaviours from your page fans towards the content you publish, and it’ll allow you to correlate that to what you’re doing on other platforms as well – Twitter, YouTube, blog etc.
[…] Engagement Rate – out of Fanbase or out of Reach? […]
[…] Facebook Page, but it’s the number of interactions between Facebook users and your page. One person can comment, like, and share on your post and it’ll be counted as 3 PTA, even thoug… [More on this here.] So now you end up with big figures that look good on paper and sound good in […]
[…] or your Facebook Page, but it’s the number of interactions between Facebook users and your page. One person can comment, like, and share on your post and it’ll be counted as 3 PTA, even though it… [More on this here.] So now you end up with big figures that look good on paper and sound good in […]
[…] AnalyticsEngagement Rate – out of Fanbase or out of Reach?2 months ago […]
[…] AnalyticsEngagement Rate – out of Fanbase or out of Reach?2 months ago […]
[…] already written about how I feel about engagement rate and how I think it should be measured. Thankfully there are tools out there that already calculate […]
[…] MediaSocial Media AnalyticsEngagement Rate – out of Fanbase or out of Reach?4 months […]
[…] Facebook have started rolling out the new Facebook Insight dashboard to Page owners and I have to say – it’s pretty awesome! While taking notes to review it, I noticed… […]
[…] MediaSocial Media AnalyticsEngagement Rate – out of Fanbase or out of Reach?5 months […]
[…] MediaSocial Media AnalyticsEngagement Rate – out of Fanbase or out of Reach?5 months […]
Hey Ben – looking at your math on the Engagement by fanbase. How are you calculating 56% for engagement rate?
Engagement Rate (by Fanbase) = (Engaged Registered Attendees + Engaged +1) / Registered People
Engagement Rate = (20+4) / 160
Engagement Rate (by fanbase)= .15 or 15%…
Am I looking at the incorrectly? If so, does your conclusion still hold true?
You’re right Isaac, thanks for spotting that out! I’ve just made the changes to reflect that. Much appreciated!
What are your thoughts about doing something like: 28 Days Engaged Users / 28 Days Total reach to obtain a 28 Days Engagement rate. Would that be incorrect? Should I also divide by number of posts made that month? Also I always wonder how albums are counted cause they never appear properly in the Facebook Analytics (old or new).
Hi Alexandre! If you want to have a 28-day engagement rate, that formula works just great! I recommend that for people who are looking for an (approximate) monthly engagement rate. As for dividing by the number of posts, you can do so! Just divide the Engaged Users by number of posts before you divide by Reach. Lastly, albums. This is a bit tricky, mainly because Facebook doesn’t show you the number of engagement and reach per picture in your album but only for the whole album as a whole. This means that:1. Everything is added up;
2. You can’t tell which pictures performed better than others.
According to Facebook Insights, photo albums are classified as “photo” (even though they’re multiple photos).
However, here’s a little known fact: if you post multiple pictures NOT as part of a photo album (hence creating a multi-picture post), that confuses Facebook, so within the Facebook Insights export that post is considered as “picture” (so you’ll see the high engagement that pictures get)…HOWEVER, if you look at your Facebook Insights dashboard, Facebook looks at that post as a “status update”, so you get the increased reach that status updates usually get. Pretty handy trick!
Finally someone that really puts its hands (head?) in the dirt. Thanks ! I wrote about the same subject on my blog. Then you probably had the same reasoning for Twitter engagement rate… But how to access the data of the real reach of a tweet, knowing every tool that I know pretending to do so are actually just adding the number of followers who tweet and retweet a tweet ??
Hi Jerome, thank you so much for the feedback! The ‘true reach’ for Twitter has always been the ‘Holy Grail of Twitter Analytics’, as I like to call it [http://bit.ly/TWReach]. HOWEVER, Twitter recently made an update to their Analytics dashboard adding stats for Twitter cards (and if you haven’t already activated them for your blog, I definitely recommend it!). I’ve posted a few tweets using Twitter card and here’s what I saw: http://cl.ly/Tjsc
Yup, FINALLY Twitter is making Impressions (and Reach) available! Hopefully Twitter will make it available for other tools to use too, so we can have true reach – at last!
Thanks a lot Ben, from france it seems that impressions are only available for promoted tweets
You’re right @jeromedebeauvoir:disqus, Twitter has recently made impressions available not only for promoted tweets but also for Twitter cards too, so if you do have a blog or company site you often tweet from, this is the time to enable Twitter cards for it.
Ben,
I agree with you on PTAT. I’d rather track the specific actions that underlie the analytic.
We report on a monthly basis, so we total our Facebook Daily Page Consumptions (defined by Facebook as “The number of clicks on any of your content. Clicks generating stories are included in “Other Clicks.” Stories generated without clicks on page content such as liking the page in Timeline are not included”), as well as track the specifics that make up Engagement rate based on the SocialBakers equation.
Why or why not should we replace likes, comments, shares with total daily page consumptions? Would that be a more accurate way to measure engagement as well?
I know this is out of scope for the specific story, but why not include Favorites in calculating Twitter engagement? To me it’s a sign that, for whatever positive or negative reason, the person makes a public action that accepts/acknowledges our content as written.
Hi @sabbadoo32:disqus, thanks so much for your feedback! In answer to your questions:1. i suggest you don’t replace likes, comments and shares – use both (engagement as well as consumption) to begin with and see which one you find more useful. You can have one engagement rate that looks at people liking, commenting and sharing, if those are the 3 main actions you’re looking for; consumption looks at a lot more than that, including clickthroughs too. This will give you a bigger picture of how engaged your fans are. Using the two initially will also show you whether your fans are more engaged in other ways that you might not be aware of – ways that you would miss if you were to only use likes, comments and shares.
2. For Twitter engagement, definitely use favourites too. While retweeting is a public acknowledgment of your content, a favourite is a ‘silent’ acknowledgment that only you and them get the notification for. Definitely use mentions, retweets and favourites – Twitter Analytics gives you a nice breakdown of these three, so you can use that data to calculate your engagement rate.
Let me know if you have any more questions!
Hi there,
I have a couple questions. For the Engaged Users/Reach formula, do you take the average of Engaged Users & divide it by the Average of Total Reach? And also, is this formula strictly for posts?
Hi @lequantanimoto:disqus! In answer to your questions:1. For the ‘Engaged Users/Reach’ formula you can take an average of engaged users and reach if you’re looking at different posts or multiple days for instance. If you’re looking at 3 posts, you can divide the average of engaged users for those three posts and divide by the average reach (again, for those 3 posts). As a result of that, you’ll get your average engagement rate for those posts/time period.
2. You can use the formula at a page level as well. If you download the page level export from Facebook Insights, you can then see how engaged your page was for your chosen time period. Bear in mind that this includes any engagement within your page, and that the page engagement rate is always different from your post engagement rates, so treat them differently.
Let me know if you have any more questions!
Hi Ben,
Thanks for the reply! I think I understand you a little bit better now. Should I take the Total Reach? Also, I’ll give you an example. I’d like to know if I’m doing my calculations correctly, so that I can present my boss with accurate data.
Let’s say I had 5 posts during a two-week period. The sum of Total of Engaged Users is 122 and I divide that by the number of posts which is 5, then I get 24.The sum of Lifetime Post Total Reach is 961, and I divide that by 5 again so I get 192. The answer would then be 12.5%. Is this correct? I feel like I’m doing something wrong here! This is my first time and I am intern, so everything is new to me. Thanks for your help!
It depends on what kind of engagement you’re looking for. So, for instance:(Post Engaged Users) / (Post Reach) will give you the engagement rate for that post; if you have multiple posts and you want to calculate the average engagement rate for those posts, like in the example you used, you use this formula: (Sum of engaged users) / (Sum of reach).
Your way of doing it (using the average) isn’t wrong either – whether you add all the engaged users OR you take an average of them, you’ll get the same result – try it out if you want, that’s some maths magic 😉 However, as dividing both engaged users AND reach by the number of posts is an extra (redundant) step, you can do without it. And yes, 12.5% is the engagement rate for those posts!
So don’t worry, you’re not doing it wrong! I’ve just seen your email – let me know if you need some more help! Good luck in your internship 🙂
Hi Ben! Thanks for your response. I did the calculations, but I’m still a little confused.
For my period between Jan. 21st — Feb 3rd, I had only 5 posts. The post engagement rate would be 10.1%
For my period between Feb 3rd — Feb 17th, I had 10 posts. The post engagement rate would be 12.1%.
The period between Jan. 21st – Feb 3rd still seems pretty high. The formula (Sum of engaged users/Sum of reach) doesn’t factor in the 14 days, so I don’t know if this calculation is particularly accurate.
Also, for the engagement rate, do I take (sum of engaged)/(post)/(sum of reach)? Thank you!
Ben, I really like your idea of breaking out Engagement Rate of Organic Reach vs Engagement Rate of Paid Reach. However, I am looking in my Excel download of Post Level Data for 2013 and I see Lifetime Engaged Users and Lifetime Post Consumers but I don’t see where there is a separate tally of Engaged Organic Users and Engaged Paid Users – it all seems to be lumped together into that Lifetime Engaged Users number. Can you clarify how I might divide this number so that I can come up with different engagement rates for Paid vs Organic?
Hi @orion_prout:disqus, thanks for the feedback! Great question – looks like Facebook have changed things up a bit, BUT you can still find those metrics within the post level exports. in the key metrics sheet, the last columns (usually between columns W and AC) are a breakdown of various metrics (engaged users, consumption, negative feedback etc.) from people who have liked your page. You also then use this breakdown as your numerator and Organic Reach as your denominator. For Paid Engaged Users, simply subtract the organic engaged users you’ve just found from the total number of engaged users. Those columns are supposed to replace the old “virality” metric we used to have, so since we don’t have the organic vs. viral vs. paid distinction anymore but only organic vs. paid, those 7 columns will help you with the organic vs. paid engagement rates.Let me know if you have any more questions!
Thanks, Ben for sharing. From the latest FB post level export, i see “Lifetime People who have liked your Page and engaged with your post” (Key metrics – Column W) as the closest metric to what you referring to.
However, this only takes into account fans who engaged with your post through organic reach. Why are you excluding NON-FANS who engaged via organic reach as well? If we take TOTAL ENGAGED USERS and subtract this, we are over-attributing to what we assume as engaged users via paid reach.
This is the flaw of the method you proposed. Paid vs. Organic engagement rate is thus not established. Do you see better alternatives?
My agency currently uses the Engagement Rate metric to measure Facebook post performance for our clients. It has been interesting to view Total Engagement Rate of posts (for total audience) vs. Fan and also Non-Fan Engagement Rates on posts.
[…] MediaSocial Media AnalyticsEngagement Rate – out of Fanbase or out of Reach?10 months […]
Hi Ben,
You Post is really good. Thank you. I have a question about the users that are paid or organic. I had downloaded the post level from my facebook fanpage but I couldn’t count the users that are organic. I can see the people who has liked my fanpage and had interact whit any of my post but it doesn’t means they are reached by post organically; I can paid to reach people that is already fan. I’m a little bit confused. Thank you so much!
Hi Nicholas, thanks so much for the feedback and apologies for the delay! I see exactly what you mean – Facebook doesn’t explicitly tell you how many of your fans saw your posts organically, BUT it does give you enough metrics to calculate that. In the post-level export, your column T should be “Lifetime Post reach by people who like your Page”, while your column V should be “Lifetime Paid reach of a post by people who like your Page”. If you subtract V from T, you’ll get the organic fan reach. If you want you can also show that as a percentage, to see how your organic fan reach fluctuates over time.
Hi Ben,
Great post! This will be very useful when educating clients about FB analytics best practices. In fact, I am responding to a brief now that asks for the dreaded PTAT. Thanks!
2 questions:
1) When you say “this is especially useful if you need to benchmark your Page against other pages Just use this formula…,” you imply that there is some way to establish the reach of a competitor’s page/posts. I have yet to see a way to establish competitor reach. Are you aware of a tool or process that would allow me to collect this information?
2) I feel there must be a 3rd way to determine engagement rate, because dividing by reach creates some challenges of its own. If we pay an astronomical amount of money to promote a particular post, it is unlikely that the total engagements will increase at the same rate as the reach – no matter how intrinsically engaging. The same post might get 3 clicks out of a reach of 10, but when you pay for it to reach 1 million, it is unlikely that 300K will engage. Because of this, these posts come out of the new equation as looking less engaging.
I’d love to hear your thoughts on this.
Cheers!
Hi, thanks so much for your feedback!
In answer to your two questions:
1. That was meant in the context of benchmarking multiple pages you own (e.g. for agencies who take care of more than one page, or a company that has several Facebook Pages, like Buzzfeed). I’ll clarify that in the text, thanks for pointing that out!
2. You’re right, there’s more than just 3 ways to calculate engagement rates, and in fact I could even dedicate a whole article about the various types of rates you can calculate (especially now that PTAT is gone). However, interactions DO increase with reach, although the proportion will always be off. So, for instance, a post with a reach of 10 might get 3 clicks, while a post with a paid reach of 1,000 might get 50, or perhaps 100 – that will be more than the organic post, but when you increase the reach you’re also increasing the chances for more engagement. There’s no formula to correctly calculate the proportion of engagement you might get, although you can calculate your averages for your own Facebook Page(s) to track how your engagement changes over time – if you see that as time goes on you’re paying more but you’re getting less engagement, then (A) it’s probably Facebook tinkering with their algorithm, and/or (B) it’s perhaps time to tweak your content strategy.
Hi Ben,
Thanks for sharing an awesome article, this is really helpful for me. I have a few question about [engagement rate/reach]: How do i get the number of Engagement user reach in organically reach/virally reach and paid reach? In my Facebook report, it’s just show the total of engagement user (both in organic reach & paid reach).
@berny90:disqus, does a high engagement (out of reach) increase the reach over time? Is that the facebook code?
And if so… what is a high engagement rate? And do comments, shares, likes, and clicks weigh different?
Hi @paulcoman:disqus, a high engagement (out of reach) has a direct impact on reach, as the more people engage with your content, the more people see it in their News Feed as “viral reach” (from friends of fans). However, that “viral reach” doesn’t last long – it can sometimes last up to 72 hours before it dies down.
Comments, shares, likes and clicks do weigh differently for Facebook: the first three will result in some of your friends seeing your activity on their News Feed, while the content that you click won’t be shown to others, so that has more weight for you (as Facebook will resurface similar content from pages you like as well as ads for targeting), than for your friend (who won’t see that you’ve clicked on a link to Buzzfeed, for instance).
Lastly, on examples of a high engagement rate – there’s no perfect number out there. This entirely depends on (1) your page, (2) how many likes your page has and (3) how much reach you get as a consequence. So, for a new page, their engagement rate might be somewhere around 15% or perhaps more, while for a page that has over 100k fans yet with little engagement, a rate of 10% is ideal. The best way to find what a high engagement rate is for you is if you download the exports from Facebook and work out your lowest and highest engagement rates, as well as the average. If you have more than one Facebook page, you’ll see that the “high” differs a lot.
[…] Engagement Rate – out of Fanbase or out of Reach?: not all engagement rates show actual engagement. I went into detail in this post to show how different ways of calculating engagement rate can make a lot of difference. It got a few people thinking, including Socialbakers, which were strong advocates of calculating engagement rate out of fanbase. (They later introduced engagement rate out of reach, and linked me in their blog post announcing this – yay!). This debacle comes mainly from the fact that a lot of tools calculate engagement rate in their own way without fully disclosing how they calculate it. My main takeaway from this post is well put in the last paragraph: […]
Finally, some proper thinking on this topic. I totally agree, measuring engagement on all-up fanbase is wrong and provides useless data. The only way “Fanbase” can be used is if Facebook promoted your campaign to every fan, which they don’t.
It’s like distributing 1,000 letters in a city of 50,000 people and measuring “open rate” based on 50,000 instead of the actual letters sent. It makes no sense. Fanbase is your “potential audience” for a given campaign. They become part of the engagement metric only if they were actually exposed to the campaign. This is important because with proper engagement data, you can run limited campaigns and project the engagement rate for the remaining fanbase that were not exposed to your campaign, and expand marketing efforts to reach those people. You can’t get that metric using “Engagement out of Fanbase”.
[…] way an engagement rate is calculated can totally change the output of such ratio, whether it’s an engagement rate for Facebook, for Twitter or another social media […]
Hi Ben and thanks for sharing! Is there any benchmark of categories or markets for the formula [Engaged Users] / [Reach] %?